

Blog Post | Simulating Crash Test MEA12
In their paper “Data from Five Staged Car to Car Collisions and Comparison with Simulations” [1], Bailey et al, compare a series of five staged collisions to the simulated performance of the PC-Crash application. Like Virtual CRASH, PC-Crash uses the Kudlich-Slibar impulse-momentum model to simulate vehicle collisions [2, 3, 4, 5]; additionally, both use a “linear” tire force model. One therefore expects to see similar behavior from Virtual CRASH when simulating the same staged impacts.
In this blog post, we discuss the simulation of test “MEA12” from this series. In this test, a 1980 Datsun 200 SX with initial speed of 15.6 m/s impacts a 1989 Chevrolet Sprint with initial speed of 6.7 m/s. The collision occurs in a 90-degree t-bone configuration. A depiction of the test is shown below.
The test results, including the impact and rest (x,y,yaw) coordinates for each vehicle, are given in Figure 3 of reference [1], and are shown below.
In order to test the collision model performance of PC-Crash, the authors of reference [1] took the estimated collision parameters, point of impact and the coefficient of restitution, and used these as inputs to their simulation. The vehicle initial positions were set to the documented vehicle positions at the moment of maximum engagement and the true initial speeds where used. The authors used “normal” suspension settings for the vehicles, cg heights as recommended from reference [6], and other vehicle geometry data from the Canadian Vehicle Specifications Systems [7]. The vehicle weights and front/rear distributions were directly measured. The post-impact drag factors and steering angles were determined in the second part of their analysis described below. The authors compared the time-history of PC-Crash simulated and measured lateral and longitudinal speed components, as well as the yaw rates, for the first 400 milliseconds starting from the moment of impact. On the location of the point of impact, the authors state: “The point of impact (POI) on each vehicle is the effective point at which the impact pulse was applied to each car, and must lie on the PDOF line. It was not possible to determine the exact position of the POI from the acceleration and angular velocity data alone. The POI was estimated to be on the PDOF line at the outer surface of each vehicle, taking into account the vehicle crush.” Table 3 of reference [1] lists the scene drag factor, brake factors, and front steer angle used for each simulation. For MEA12, the authors assumed front wheel driver side wheel lock of the Chevy was assumed, and a 0.45 degree left steer post-impact for the Datsun.
We set up the same simulation scenarios in Virtual CRASH in order to compare the behavior of Virtual CRASH simulation to both PC-Crash and the experimentally determined longitudinal speed, lateral speed, and yaw rate versus time. The results are shown below. The Virtual CRASH simulated post-impact conditions were set to match those used in PC-Crash, where 1% \(\mu\) braking was used for all wheels except for the Chevy, which was set to 100% \(\mu\). The Datsun’s steering angle was set to 0.45 degrees.
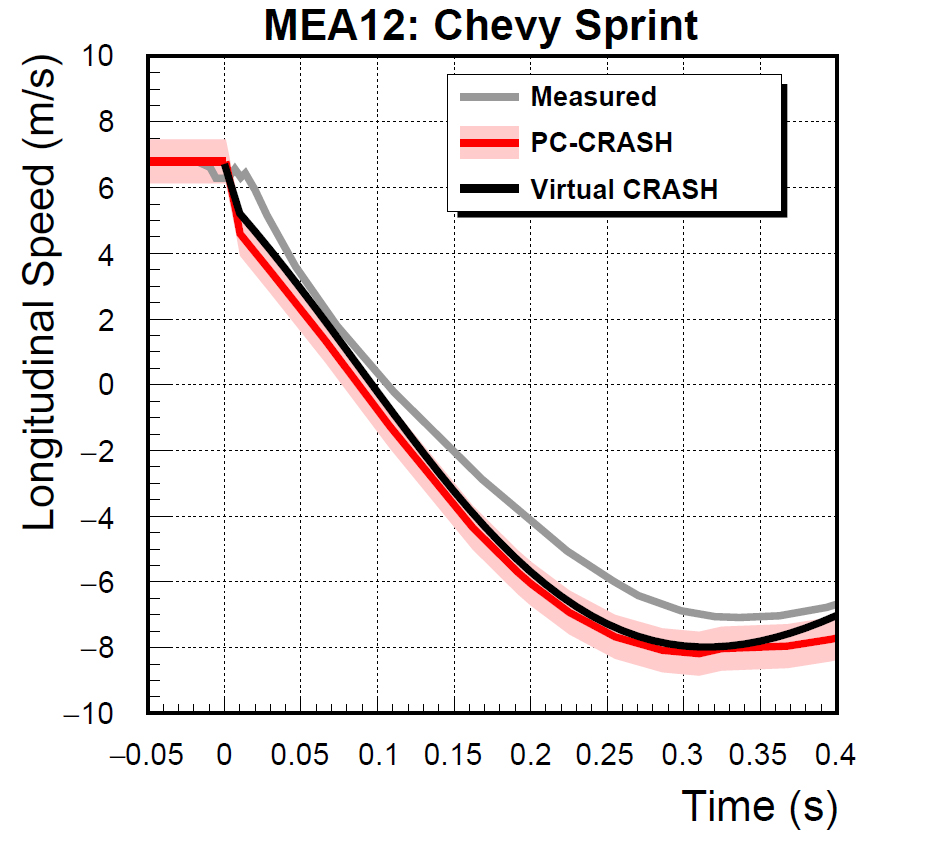
In the plots below we see the longitudinal and lateral speed versus time graphs for the Chevy Sprint. The measured values are depicted in gray [8]. The PC-Crash results are shown in red, with a light red shaded band that is 3 mph in total width centered about the PC-Crash line. The Virtual CRASH results are shown in black. In both cases, we see excellent agreement between the PC-Crash results and Virtual CRASH results to within 1.5 mph. Note, some parameters used by the authors of [1] were not revealed such as the moments-of-inertia and integration time-step size used for their simulations, so some minor differences are expected. We plot the data in 10 millisecond increments as did the authors of [1]. The 10 millisecond increments give the appearance of a gradual change-in-velocity; however, the Kudlich-Slibar impulse-momentum model assumes instantaneous velocity change to interacting vehicles. The authors used 10 millisecond increments to make it easier for the reader to interpret the plots as abrupt vertical lines can make comparisons of various graphs difficult. Below, we also see the Yaw Rate versus time for the Chevy Sprint. Again, the PC-Crash are shown in red, with a light red 0.5 rad/s band centered about the PC-CRASH line. Excellent agreement is observed between PC-Crash and Virtual CRASH, as well with the experimentally measured results.


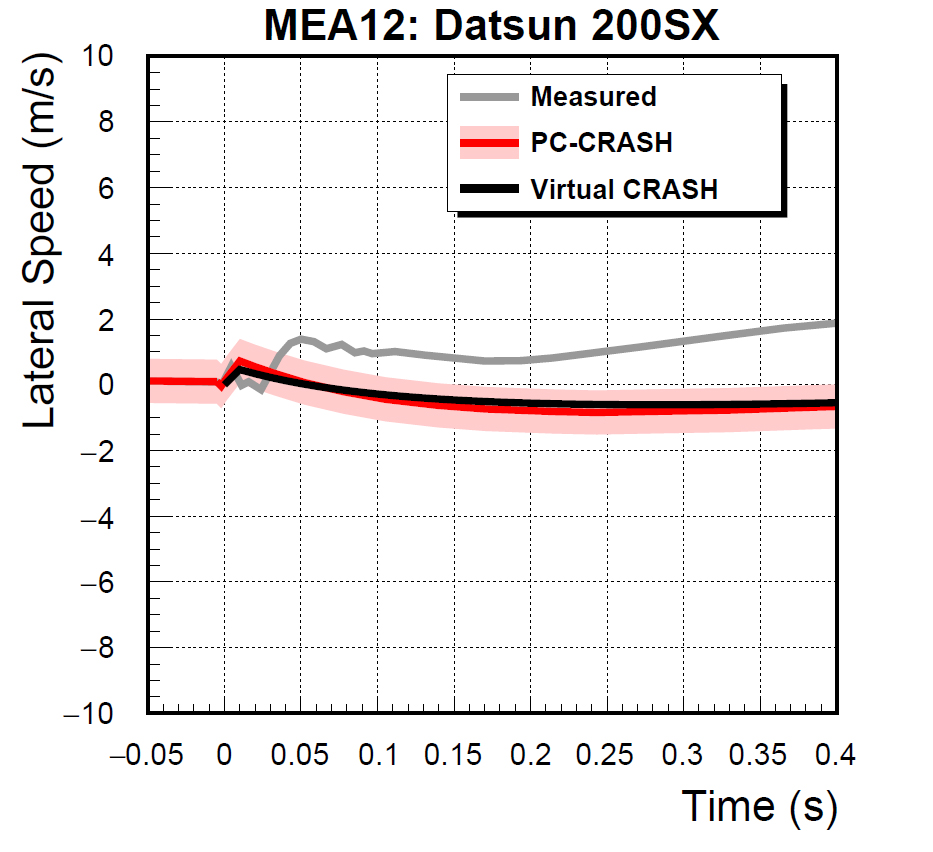
Finally, we have the lateral and longitudinal velocity versus time graphs for the Datsun. A 3 mph wide band is drawn centered about the PC-Crash curve again. We see excellent agreement between Virtual CRASH and PC-Crash.

The authors of [1] asked an analyst, purportedly ignorant of the specifics of each test, to reconstruct each test with the help of the PC-Crash auto-optimizer tool, using only knowledge of the crush damage, coefficient of friction at the scene, as well as intermediate and final rest positions for the vehicles. The participant was tasked with estimating the pre-impact speeds. We performed the corresponding simulations in Virtual CRASH. While in other validation exercises [9, 10, 11, 12] have taken similar approaches to the authors in [1], in this case, we chose to further test the collision model by attempting to converge on a good simulation scenario by focusing only on the collision model input values.
First, starting the vehicles at the positions reported positions of first contact, and using the known initial speeds, we varied the impulse centroid location (point of impact), coefficient of restitution, and depth of penetration until we obtained a good match satisfying our final position and orientation constraints. The scale diagram shown in Figure 3(a) of reference [1] was imported into Virtual CRASH and the depicted tire marks of the Chevy were used as additional constraints on our simulations. The same post-impact braking factors were used as in the prior test, but no post-impact steering was needed for the Datsun. Since the Datsun was likely remotely braked to bring it to rest, we first ensured the simulated Datsun ran through the documented rest position, then applied additional braking prior to reaching the rest position. In this case, we were able to converge on a good simulation solution in a short time using the interactive real-time feedback of the Virtual CRASH simulator. A 15 millisecond depth of penetration value was used with 11% restitution. \(\Delta V\) matched experimentally measured values to within 0.1 mph (0.1%) for the Datsun and 1.8 mph (12%) for the Chevy. The simulated PDOFs agreed with measured values to within 5%. In this case, we were able to match the rest positions to within 0.165 m (6.5 in) and rest orientations to within 0.5%. Note, here PDOF is defined with 0 degrees directed forwards and 90 degrees to the left. This convention means that a frontal collision with a rearward directed force has a PDOF of 180 degrees.
A summary of the results is shown below.
The simulation sequence is shown below.
A video of this simulation is shown below.
Next, we relaxed the constraint on initial speeds, allowing them to vary along with the above described parameters, until we found improved position convergence. Relaxing the initial speeds by no more than 1 mph from the true initial speeds, we were able to find good solutions such that \(\Delta V\) matched measured values to within 1.5 mph for both vehicles with rest positions matching to within 0.087 m (3.5 in). In this optimization, a 20 millisecond depth of penetration time was used and 11% restitution. A summary table of the results is shown below.
The simulation sequence is shown below.
As expected, in this study, it has been demonstrated that the performance of Virtual CRASH agrees extremely well with PC-Crash, as they both use the same underlying collision and trajectory models. Both simulation models do well to reproduce the measured behavior of the vehicles in MEA12.
References
[2] Slibar A., Die mechanischen GmndsXtze des StoBvorganges freier und gefuhrter Korper und ihre Anwendung auf den StoBvorgang van Fabrzeugen, Archiv for Unfallforschung, 2. Jg., H. 1, 1966, 31ff.
[3] Kudlich H., Beitrag zur Mechanik des Kraftfahreug-Verkehrsunfalls, Dissertation TU-Wien, 1966. Dissertation available at the Vienna University of Technology library system.
[4] Steffan, H. and Moser, A., The Collision and Trajectory Models of PC-CRASH, SAE 960886, 1996.
[5] Virtual CRASH User’s Guide, Appendix 1: Single Body Collision Physics Model, http://www.vcrashusa.com/guide-appendix1
[7] http://www.carsp.ca/research/resources/safety-sources/canadian-vehicle-specifications/
[8] Note, the plots presented here of the measured and PC-Crash values from reference [1] were recreated in this post by reading off values directly from [1] using the xyscan application (http://rhig.physics.yale.edu/~ullrich/software/xyscan/).
[9] http://www.vcrashusa.com/guide-chapter12-vc5
[10] http://www.vcrashusa.com/blog/2016/9/29/staging-a-car-crash-ricsac-2
[11] http://www.vcrashusa.com/blog/2017/2/9/staging-a-car-crash-ricsac-3

